Hello!
I’m a research scientist at the National Oceanographic and Atmospheric Administration’s Geophysical Fluid Dynamics Laboratory (GFDL). At GFDL, I work to better understand the patterns and drivers of sea level variability using both observations and state-of-the-art ocean and earth system models. I’m interested in leveraging new tools to wrangle large and cumbersome datasets to extract and understand patterns of ocean variability. With these tools I work to combine a dynamical understanding of ocean dynamics with data-driven identification of connections among observable quantities.
My approach in pursuing these interests was shaped by my time at Woods Hole Oceanographic Institution WHOI, leveraging observations collected by satellites, ships, moorings, floats, and autonomous underwater vehicles to study the ocean. At WHOI, I was luck to be a member of both The Ocean Transport and Eddy Energy Climate Process Team and the NASA Ocean Surface Topography from Space Science Team.
I’m always looking for new collaborations and am eager to help make ocean science more approachable and understandable.
In the news:
- Why Seas are Surging, 2024-12-20, Washington Post
- The New Face of Flooding, 2024-04-29, Washington Post
- Seas have drastically risen along southern US coast in past decade, 2023-04-10, Washington Post
interest in ocean eddies
Of the many shapes, sizes, and types of eddies found in the ocean, I’ve always been interested in those that can live for many months and have the potential to trap and transport heat and nutrients over many hundreds of kilometers. Most eddies, including these coherent vortices, are surface intensified, but vertical structures extending below the thermocline mix isolated water masses and play an important role in the transfer of energy to the deep ocean. While larger and persistent eddies can be observed from altimetric observations of sea surface height, many are missed because they are too small or sub-surface intensified. My interests in eddy vertical structures thus range from topographic steering to decomposing surface observations into interior contributions.
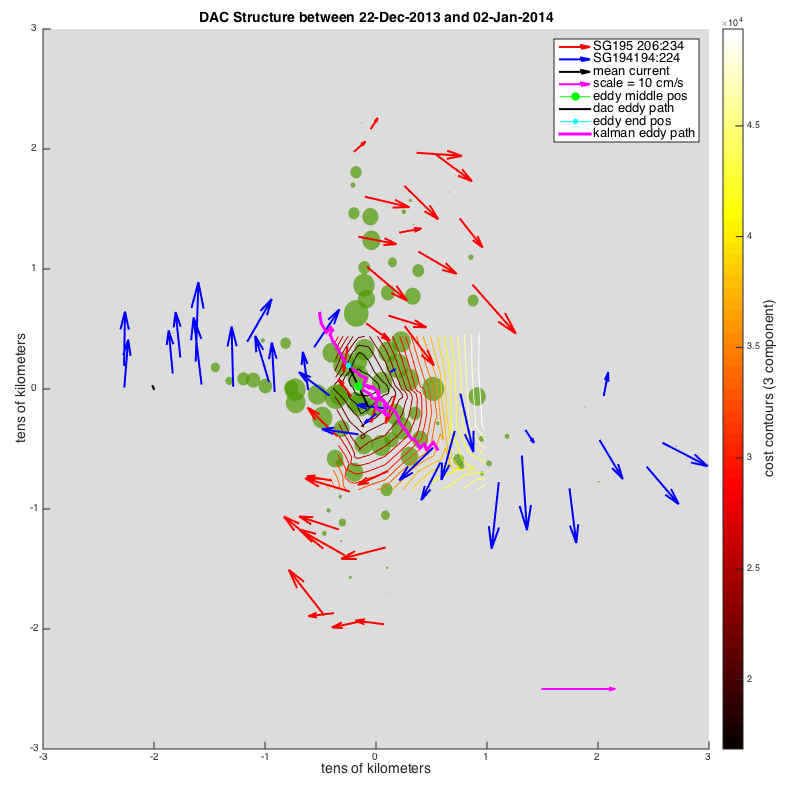
Below is a figure generated from observations made by multiple Seaglider autonomous underwater vehicles. These gliders were deployed as part of a 2013-2014 field campaign to find and follow a single eddy off of the Washington coast. This work was carried out to observe eddy evolution and show that gliders enable the tracking of prevalent features that satellite observations would miss.

The radial structure and symmetry of this coherent eddy can be seen in the colored depth-average current vector estimates. The locations of these vectors identify glider collected profiles relative to an estimate of the moving eddy center. In plan view, red and blue arrows are 0-1000 m depth-average velocity vectors, green circles indicate the vertical distance separating two density surfaces (one above and one below the core depth at ~ 200 meters) (larger circles correspond to greater vertical separation), and the colored contours map a cost function whose minization determines a best estimate of the eddy center location over a ~ 2 week period.

